Are you looking for an efficient illustration of your biomedical data so you can share it?
Several different types of visualization systems have been developed to handle different types of data like in Python or for molecular dataviz. Biomedical data is generally multi-modal (imaging, genomics, demography), multi-scale (molecule, cell, tissue, organ, organism), and large-scale.
This is why multivariate visualization tools are often used in biomedical data mining and may provide a starting point for your analysis.
So let’s take a look at our top tools for biomedical data visualization.
T-BioInfo
Online tool • Made in USA • Price on demand
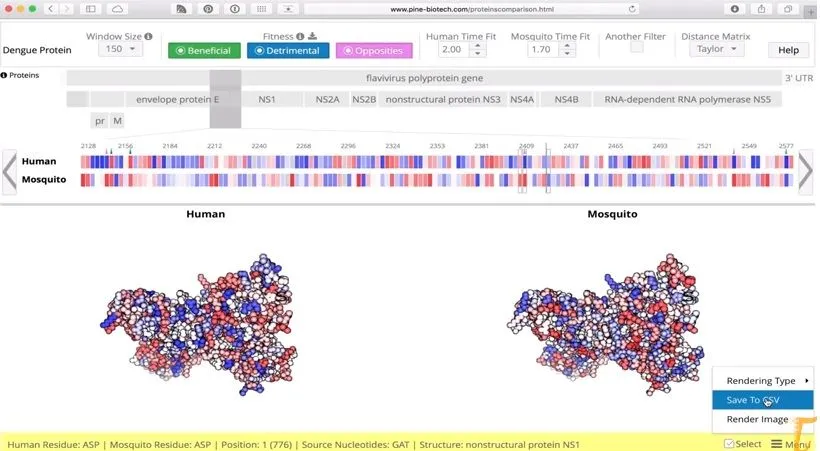
Pine Biotech data visualization services specialize in the analysis and mining of big biomedical and agricultural data.
The aim of the Pine Biotech company is to use bioinformatics to enable discovery of molecular diagnostics, small molecules, vaccines, and other therapeutics. They do it through a powerful multi-omics analysis platform called T-BioInfo.
MSVTK
Online tool • Made in Europe (UK, Italy, Spain), USA, New Zealand • Free
It is an open-source software library and a multiscale visualization toolkit. It allows multiscale data collection and multiscale modeling.
The library provides software components that can be used in a biomedical software project. Here is an example using the “click and zoom” application to visualize micro and nano datasets (images on the right).
Biowheel
Online tool • Made in USA • Free (advanced paid features)
Biowheel is presented as an interactive visualization and exploration of biomedical data.
This tool enables researchers to quickly detect data outlier.
It is designed for biomedical professionals that need high-dimensional data interpretation. It allows implementing a training program of a patient for example.
FreeViz
Online tool • Made in Slovenia and USA • Free
FreeViz is an approach set out by researchers from the Faculty of Computer and Information Science of the University of Ljubljana.
It is an intelligent multivariate visualization tool that allows exploring analysis of biomedical data.
WEAVE2
Online tool • Made in USA • Free
WEAVE stands for Workbench Environment for Analysis and Visual Exploration.
It is an interactive visualization and analysis platform created by Weave Visual Analytics.
It displays maps, scatters plots, bar charts, histograms, line graphs, and more, as you can see on the example above illustrates the prevalence of Lyme disease.

次のステップへ進む
Explore Suppliers
関連する専門知識を持つ信頼できるパートナーを探す
Review Capabilities
サービス、経験、実績を比較する
Start Your Project
つながり、協業を始める